Print Transcript
[music] >> Hello, I'm Greg Bonnell. Welcome to MoneyTalk Live, brought to you by TD Direct Investing.
Every day, I'll be joined by guests from across TD, many of whom you'll only see here.
We're going to take you through what's moving the markets and answer your questions about investing.
Coming up on today's show, TD Securities Daniel Ghali will join us. We will talk about a trend he's been noticing in the gold space that investors may be missing out on.
MoneyTalk's Anthony Okolie will take us to the latest Canadian retail sales report.
In today's education segment, Jason Hnatyk will show us how to use bubble charts on the Advanced Dashboard platform.
So here's how you can get in touch with us.
Just email moneytalklive@td.com or fill out the viewer response box under the video player on WebBroker.
Before we get to all that and our guest of the day, let's get you an update on the markets.
We will start here at home with the TSX Composite Index.
We are in positive territory, 123 points to the upside, a little more than half a percent.
Among some of the most actively traded name standing out for us today is Enerplus, selling itself to Chord Energy.
On that news, the stock is up 10%.
I want to take a look at B2Gold, with their latest earnings report. Gold sitting a bit flat today to the downside modestly.
B2Gold is down almost 2% at $3.33 per share.
South of the border, the big news this week was Nvidia. The street is pleased with the report and the forecast.
Nvidia is pulling up market sentiment across the board. The S&P 500 is up 1.6%, 80 points.
The tech heavy NASDAQ hearing even better, it is up just shy of 2 1/2%. Nvidia is one of those stocks where if they do well, the market as well.
Nvidia is at $776 per share, the stock is up more than $102 or 15%.
And that is your market update.
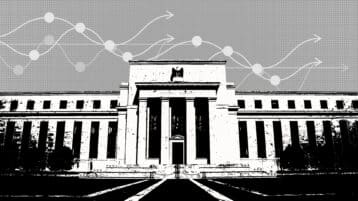
While the US Federal Reserve has preached patients when it comes to rate cuts, our featured guest today says that investors may be historically under position for the moves that gold might make when those cuts arrive. Joining us now to discuss his Daniel Ghali, Senior commodity strategist with TD Securities. Great to have you back.
>> Thanks for having me.
>> This year, we are awaiting weight cuts.
The thought is they will, but we need to be patient. What about gold? What does it mean for gold?
>> The start of the timing of a rate cutting cycle is less relevant for gold and the total number of cuts on the horizon that we can expect.
What's interesting in the gold market is that today, investors are historically under positioned for a said cutting cycle.
And why wouldn't they be? If you think about the last few years, macro traders in particular and gold have been repeatedly wrongfooted. The types of indicators that they look at like real rates or US dollar has led us astray time and again. Despite the fact that these macro traders are under positioned and after the strong series of growth data in particular in the US, they have built up a sizable net short position, gold prices are still near all-time highs.
So what gives? The answer to that is actually from physical markets. If you look at the relationship between gold and real rates over a very long term horizon, we see that relationship is fairly stable.
There are moments in time where large changes in real rates don't have much of an impact on gold.
That is happening today. The last time this happened was in the early 2000's which is an era where physical markets were larger or larger forces than financial markets and gold.
That's really the reason why gold prices haven't sold off even though macro traders are shorting it.
>> So macro traders shorting, under positioned in terms of what could happen from the Fed.
When we get to the point that we see rate cuts from the Fed. I, I think I TD Securities the thinking is you will get cuts by the summer, Robert Both was on earlier this week, what could he do to the price of gold? Will there be a rush into that trade?
>> Historically, you see a very large amount of capital that starts to move into gold and the reasoning behind that is simple.
The cost of carrying gold at this moment is quite elevated. That relates to the cost of funding your long gold position.
The US dollar interest rate is quite high so that keeps people from buying gold.
As that rate comes down, it reduces the opportunity cost for folks to start buying gold.
What we would expect and we do think the Fed is going to cut rates for the first time in May.
>> As early as May?
>> Absolutely, yes.
Our forecasts are actually for a deeper Fed cutting cycle than the market is currently pricing and because we still expect a meaningful slowdown in growth even though we are no longer anticipating a recession in 2024 in the US, we are expecting growth to blow materially. The market thinks that should be accompanied with a more meaningful Fed cut, more meaningful Fed cuts on the horizon.
>> On my screen I have an ounce of gold at $2031. If the thesis starts to play out, the Fed starts cutting rates and they go deeper than perhaps the market is anticipating, do we have substantial upside for gold?
>> We think so.
We think gold prices can trade on an average quarterly basis as 2250 by the second quarter of this year and really that's on the back of the strong physical market activity that we have seen but also this rush of capital from the investor side which has really been the missing piece from gold to sustain new all-time highs for the time being.
>> Is the biggest factor that these is simply that inflation in the states, it seems we are getting our headline inflation and core inflation down in Canada. The last print out of the US, it was a bit sticky. Is that the greatest risk into gold right now, that inflation doesn't behave?
>> From the macro side, absolutely.
Macro traders are actually net short and gold.
They are already taking positions consistent with that view. The other side of that equation, physical markets, is really what's interesting.
The exceptionally strong demand that we have seen so far this year off China isn't just associated with the lunar new year celebrations. That tends to be the seasonal peak in Chinese buying activity but we are seeing that buying continue to persist beyond that horizon. We also know that there have been a substantial amount of purchases of precious metals more broadly and that's the same case in many parts of the world, including the Middle East and Turkey as well.
So these flows are now larger than the downside pressure that we might see from macro traders from stickier inflation than expected.
>> I want to talk about silver now. Fairly or not, it's considered the poor man's gold. But you've noticed interesting things in this area too.
>> Absolutely. So far this year, silver has dramatically underperformed gold. That is consistent with the macro story that we have been discussing.
When we start to look on the horizon, there are a few very large assumptions that are being taken for granted in the market that we think could be challenged.
The first is that, one of the large assumptions and silver markets is that you will always have silver that is available.
This is a metal that's very intensively used in industrial capacity, solar is increasingly the largest structural driver of demand growth for silver, and we expect that to continue on the horizon.
Most market forecasters out there expect a structural deficit on the horizon.
So I think that begs the question, is there a moment in time where the very large amount of silver inventories that have accumulated over the last several decades will wind down by the strong industrial demand? If that happens, how will we incentivize investors to sell their physical silver holdings to satisfy physical market demand?
>> I was thinking to you, how do you incentivize miners to take more silver out of the ground. It's an interesting time and the fact that we've looked to a lot of metals that we need for many transitions, we will talk about that later, but are we minding enough of it? If we end up with a structural deficit of silver, it has industrial purposes and we need more. Are the miners going to put the money in to take it out of the ground?
>> Silver is traditionally mined as a byproduct of other metals.
It is a byproduct of zinc mines, gold mines, and so forth.
So there is a very well discussed CEM of structural underinvestment in mining activity. That has been the case for the past 12 years at least and that is now having an impact on silver. The difference in silver markets, this has appreciated, this theme has appreciated in other base metal markets, but the difference in silver markets is that there is that assumption that there will always be silver available given that… >> Don't worry about it, it's always coming out of the ground as we pull other things out of the ground.
>> Nobody is throwing away their silver.
Every ounce of silver that has been mined for a very long time still exists somewhere in some form.
The question is, how much of it is actually freely available for purchase?
When we punch in the numbers, we find a significant portion of it is not available for purchase or not occur in prices.
>> Fascinating stuff and a great start to the program. We will get to your questions about commodities for Daniel Ghali in just a moment.
And a reminder that you can get in touch with us any time.
Just email moneytalklive@td.com or fill out the viewer response box under the video player on WebBroker.
Right now, let's get you updated on the top stories in the world of business and take a look at how the markets are trading.
You knew I was going to start with Nvidia.
The stock in the spotlight today.
Right now at $776 per share, let's rounded up, 777, it's up 15%, what's going on?
Their results came out after the markets close yesterday. Not only did the chipmaker deliver on its quarterly earnings report, but it is also forecasting $24 billion in sales for the current quarter, stronger than Wall Street's expectations. Nvidia's gains today are also helping push the S&P 500 to new all-time highs. Closer to home, Loblaw is reporting growth on the top and bottom lines for the most recent quarter. The grocers saw increase the traffic in its stores, notably at its discount banners No Frills, Maxi and Real Canadian Superstore.
At 140 bucks per share, you're up 1.8%.
There is some dealmaking in the energy patch. Calgary-based Enerplus is selling itself to Houston-based Chord Energy Corp in a cash and stock deal valued at some $3.7 billion. The deal is subject to regulatory approval. It had been rumoured for a while. You can see Chord Energy down and Enerplus in positive territory, at $18.19 per share, it's almost 11%.
A quick check on the market, we will start here at home with TSX Composite Index. In positive territory, a gain of 134 points, good for two thirds of a percent.
South of the border, as Nvidia clears the hurdles market had for them and get everyone excited about AI in technology plays, you are seeing a broad-based sentiment lift in the market. The S&P 500 is up 83 points, 1.67%, 5064, touching new all-time highs.
All right, we are back with Daniel Ghali taking your questions about commodities.
Let's get to them. What has happened to the price of oil? A nice blunt, straightforward question.
>> Great question. The price of oil has been under pressure for some time.
More recently, prices have recovered.
Under the hood, there is actually a lot of evidence that supply risk premia has supported oil prices. This is something that we've been discussing for some time as well, that oil prices were not reflecting the rise in geopolitical risks that have occurred since the beginning of the year.
Certainly, the Middle East is a big concern but you also have concerns surrounding military escalation between Venezuela and their joint border with Guyana which was a tremendous success story in terms of oil production.
I think more recently, the internals of crude prices have shown that physical markets are actually quite strong even though prices are fairly range bound, as we discussed.
But there are some signs that the disruptions caused in the Red Sea by the conflict with the Houthis is starting to have less of an impact on crude prices.
So there is some signs that the strength that we have seen, aided by supply risk premia, is starting to ease.
>> Is it a case of obviously we know these geopolitical conflicts do put a lot of risk into play but until it actually means that supply is constrained, the market is not going to react all that dramatically?
>> Often times, that's the case.
In this case, supply has been impacted.
In some ways, the conflict in the Red Sea has diverted ships, so that causes a temporary dislocation in physical markets.
That's probably with helping supply risk premia ease today, that ships are starting to arrive in Europe in particular and in turn we should see steady flow shifts which will have fewer implications for prices.
But you also have had taxes on Russian refineries as well. These are relevant for global product and market.
>> Is China a big concern? We think about in North America we live through a year and 1/2 now of talk of a recession coming.
People put that recession narrative over there. But there are concerns about the world's second-largest economy in terms of what they are willing to do to stoke the growth and whether they are doing enough.
>> There has been an extreme amount of pessimism surrounding China's economy.
We actually don't see that cooperated the data out of China.
It does seem to us that demand sentiment out of China has been oversold and there are some preliminary signs that that is currently repricing, aided by the strong performance of Chinese equity indices and I think government officials have supported that market to aid overall sentiment in China.
>> Okay, I just did what we call in the industry mowing the lawn of one of our viewers next question. They want to ask you about the slowdown in China and how that could impact commodities.
We talked about oil but obviously China is a big buyer for a lot of commodities.
>> Absolutely.
You mentioned that soft landing has become more of a consensus narrative in the West.
Our tracking growth expectations are actually pointing to the fact that the soft landing story in the US is not exceptional to the US. There is a trend across China, across Europe and the US of rising growth expectations.
So this is certainly a concern for commodities markets and China could still disappoint but it does seem to us like the worst is now in the rear review.
>> If China's appetite returns, if China gets hungry again for commodities, could this set off a supercycle?
>> Absolutely.
Well, the supercycle story really depends on which market we are talking about.
There are a few ways that it can play out.
The one you mentioned is the demand side of the equation. So far, we have had very strong green demand offset by weakness in the traditional manufacturing sectors and real estate sectors, especially out of China.
But if both of those components of demand start to move in the same direction, certainly that will bring the supercycle forward for metals like copper in particular were even silver as we mentioned.
I would also say that other ways the supercycle could play out is from the supply side. Aluminum is one great example of a market where governments are proactively constraining its supply growth given that it's a carbon intensive industry.
So not only do you have a boom from the demand side but you also have governments proactively curtailing the supply side which should benefit a little bit more and bring forth that supercycle.
>> China is an economy to keep an eye on for many reasons. Another audience question. What could Fed rate cuts mean for commodities generally?
>> Generally speaking, Fed rate cuts tend to improve the growth outlook. Part of the easing and financial conditions that we have seen so far is related to expectations for Fed rate cuts, even though the Fed has not cut yet, the market has started to price those rate cuts in and market participation and market rate so that is relevant for the growth outlook even today.
So that's the channel that is most important for commodities and markets and I'd say the other China would be the opportunity cost.
We spoke about in the context of gold.
Currently, cash fields are quite high and that means that it's actually quite expensive to own a gold position. So as interest rates come down, not only do you have a growth boost which should benefit assets like copper and oil but you also have a decline in the opportunity cost which should benefit gold in particular.
>> On the currency side, we have currency Saying If You Enter a Fed Rate Cutting Cycle, You Expect the US Dollar Which Has Shown Strength to Start Pulling Back As Well. We Have To Worry about Currency to?
Often You Hear a Simple Explanation. The US Bucket Hires Oil Is Lower Because Oil Is Denominated in US Bucks.
>> Is incredibly complicated.
I think from our affect strategy team, the point that they bring home is precisely that the soft landing is not exceptional to the US. Even though the US dollar has been rallying because people of them pushing back the expectations for the Fed cut cycle, the growth story improving in China and Europe is actually negative for the US dollar and that's probably more important.
>> Fascinating stuff.
As always, make sure you do your own research before making any investment decisions.
we will get back to questions for Daniel Ghali on commodities in just a moment's time.
And a reminder that you can get in touch with us any time. Just email moneytalklive@td.com.
Now, let's get our educational segment of the day.
In today's segment, we are going to have a look at one of the different chart tools available on Advanced Dashboard.
Joining us now for more Jason Hnatyk, Senior client education instructor with TD Direct Investing. Great to see you. You're going to talk to us about bubble charts.
Take away.
>> Advanced Dashboard has lots of very unique tools that can only be found in the platform itself to really help you visualize how the market itself has been performing. I'm going to show you the bubble charts here today which will allow us to compare and contrast how different industries or sectors are performing you and let's jump into WebBroker and take a look at this right now.
Not WebBroker, Advanced Dashboard in this case. You are noticing a lot of bubbles in the centre of the screen.
The tool is very aptly named.
These are bubbles representing the TSX 60.
That is the default chart. Taking a look in the top left-hand corner, there is a drop-down menu that you can take a look at the other major indices as well as Canadian and US sectors.
Whatever you are looking for, we have that opportunity for you to do a deeper dive.
As it is set up now, this is judging the TSX 60 companies in terms of their relative performance over the last year.
The higher the bubble is, the higher performance has been over that time. A nasty progress to the right side of the chart, we can see that the companies begin to go lower based on the performance.
The next thing to point out is going to be the colours of these bubbles.
It's been on purpose that they been colour-coded.
That's so we can help to spot high-performing sectors. They are based on an individual area of the economy or market that you happen to be looking at.
We have a couple of different companies near the top of the list. That's our technology sector. The key is at the bottom of the chart.
You're looking to maybe make this… You don't want to miss the forest for the trees. We can add and remove sectors just by clicking. Let's say we want to remove the technology sector and the energy sector because we are looking to maybe do some analysis or diversify into other areas.
We now have a more clear picture where we can compare and contrast the sectors against each other just by clicking on the bottom and we can add them back in simply by tapping on the name.
Moving next to how we can adjust how we are analysing the companies against each other, you will notice that just to the right of where we were cycling through the different indices and sectors, we got the opportunity to select different areas where we can compare and contrast.
We can compare with market cap, get into more fundamental natures such as PE or yields or return on investment, things like that, great opportunities to narrow it down.
Then we get to choose other time frames and variables to compare them against.
Lastly, we talked about the colour of the bubbles. The last thing is to highlight the fact that the size of the bubble is defaulted based on market cap.
The bigger the company is, the bigger the valuation and the bigger the bubble represented on the chart.
That's all going to be just the agreed-upon metric, that something you have the ability to make that your own and really make sure you're getting the information you want to get out of the bubble chart.
Very cool tool to help you with analysis.
>> We got the bubble charts. We understand what we want to look at them. One thing that I find useful in Advanced Dashboard is being able to link this piece of information to other pieces of information. How do you start linking these bubble charts the other parts of the platform?
>> You're going to get the information that you want, where you want to see and what you want to see. Jumping back into Advanced Dashboard, I'm going to highlight the Market Pulse tab located at the top of the page. This is the factory default setting that everyone is going to have.
The bubble chart is loaded into this area.
What I want to highlight for everybody is that there are these vertical rectangles of the top of the page. This is how we link the tools together.
This happens to be linked to the green channel. All of the other components on this page are linked to the green channel.
If I go ahead and select one company, out of the list, I click on Shopify.
You are noticing that a quote is popping up.
Our option chain is popping up as well.
There are different tabs. News is available for me to get specific to the company and that's not just limited to only within the same tab. If we look at different tabs that everyone will have available, I'm going to go to the analytics tab, it's linked to here as well so it's linked to the green component. We got financial statements, we can look at, let's see, we've got other ratios and things like that so once again is just scratching the surface in terms of what's available but one click on a little bubble is able to give me a wide perspective of what's going on across the economy and if we are drilling down into that individual security as well.
>> Thanks for that.
>> It's my pleasure.
>> Jason Hnatyk, Senior client education instructor at TD Direct Investing.
And make sure to check out the learning centre in WebBroker for more educational videos, live, interactive master classes and upcoming webinars.
Now before we get back to your questions about commodities for Daniel Ghali, a reminder of how you can get in touch with us.
Do you have a question about investing or what's driving the markets?
Our guests are eager to hear what's on your mind, so send us your questions.
There are two ways you can get in touch with us.
You can send us an email anytime at moneytalklive@td.com or you can use the question box right below the screen here on WebBroker. Just write in your question and hit send.
We'll see if one of our guests can get you the answer right here at MoneyTalk Live.
Okay, we're back with Daniel Ghali, taking your questions about commodities.
This one is on copper. What do you expect the supply and demand of copper to look like in the next two years?
>> That's a really interesting one because if we were to have the discussion in November of last year, the answer would probably be significantly different. We have had a series of very significant disappointments on the supply side. These relate to legacy projects that start perhaps around the year 2017 which were just about to come to completion that were expected to shift the market balance to a pretty significant surplus, especially over the next 12 months and less so beyond there.
So that was the period of time that would have seen a surplus before a period of structural deficits. Increasingly, it looks like copper markets are going to be in a deficit this year even though we expected a surplus not too long ago.
>> The Cobre Panama situation where you thought you're gonna have this massive, the world's biggest were one of the world's biggest copper mines coming online and then obviously there are things going on in Panama right now but that mind is not operating.
>> That's a big chunk of it.
Ultimately what this means is that the period of structural deficits and copper might be coming as soon as this year.
So we do have critically low inventories and copper markets and a period of time work demand is going to grow at a very fast pace.
So that is troublesome for copper markets and it does suggest that copper prices are actually still substantially below where they need to be in order to incentivize new production on the horizon.
>> We talk about copper and electrification and when we talk about the world trying to green itself through the electrification of everything, including cars, you're gonna need a lot of copper.
Do the headlines around the EVs and demand being soft way on copper in a way that perhaps it shouldn't?
>> I think so. In some ways, there has been a pessimistic tone surrounding the EV boom.
Globally, EV sales are accepted to grow at around 20% year on year.
That is a slower pace than the prior year but it's still tremendous growth and even though the concerns probably relate more to battery electric vehicles and increasingly hybrids are one way that automakers are pushing for, they still consume substantially more copper than traditional combustion engine. This is still in our view a very positive outlook for copper demand growth.
>> This is a question about geopolitics.
Are we still seeing an impact on commodities from the Ukraine Russia conflict?
>> What's fascinating about commodities markets is that they have reshuffled themselves in the aftermath of the conflict with Russia at a really fast pace, far faster than most commodity strategies expected by the world and by us. So far, there have been fairly few disruptions as a result of that. Flows were reshuffled but not wiped out. Part of the reason is that sanctions enforcement was really lax, far more lax than governments had initially thought of.
So far, there aren't that many disruptions for energy markets in particular, nor are there for the types of commodities that Russia produces a lot of, things like aluminum or palladium but we have seen those flows reshuffled across the world.
>> What about the prospect of more sanctions? Obviously tensions have not eased at all between the United States and Russia. Could we be seeing more sanctions or perhaps more strenuously and for sanctions?
>> That is a source of concern.
This week, we heard that the US is going to announce sanctions, new sanctions on Russia which initially sent aluminum prices, palladium prices, copper prices quite significantly higher. So far, prices have come off in a synchronized fashion as well which tells you that there is some scepticism around whether Western nations will sanction access to these commodities because there is a sense that that is self punitive. But that is something we should hear more about this Friday.
>> Okay. Let's get another question now from the audience.
How is the slump in EV sales heading commodities?
We talked very specifically about copper and electrification, but we know that when it comes to EVs there is more than just that.
>> We spoke about the fact that EV sales are slumping. This is probably the battery electric segment but overall globally, electric vehicle sales are rising at a really fast pace. So this is very useful for copper as we discussed but it's also useful for a variety of different commodities. Metals are, the peace that I would look at, aluminum is more heavily used in electric vehicles, same strategy for zinc. The other side of the equation is actually there is some evidence that the much faster penetration of electric vehicles then was initially anticipated is starting to impact oil demand as well.
That's a negative for oil demand. I think today, globally, EVs are about 4% of the fleet and it's actually starting to show up in demand forecasts for oil.
This is the first time that it's a material reduction related to electric vehicles.
>> Fascinating things to consider when talking about the EV market and demand. We will get back to your questions for Daniel Ghali in just a moment's time.
As always, make sure you do your own research before making any investment decisions.
And a reminder that you can get in touch with us at any time. Do you have a question about investing or what's driving the markets?
Our guests are eager to hear what's on your mind, so send us your questions.
There are two ways you can get in touch with us.
You can send us an email anytime at moneytalklive@td.com or you can use the question box right below the screen here on WebBroker. Just write in your question and hit send.
We'll see if one of our guests can get you the answer right here at MoneyTalk Live.
We saw a rebound in December in retail sales in this country, a big boost from auto sales, but 2023 still marked the slowest year for holiday sales since the pandemic began.
Anthony Okolie joins us now with TD Economics take on the latest numbers and what we might be seeing the rest of the year.
>> Canadian retail sales did rebound, they are a .9% month over month in December, slightly higher versus stats Canada's flash estimate of .8%.
Today's growth even stronger adjusted for inflation. Retail sales were up .8%. Stats Canada's advance read for January points to a bit of a pullback. It suggests that sales slowed down to 0.4% based on respondents from roughly half of retailers surveyed. So you're down 0.4%.
Gains were seen in five out of the nine subsectors. The biggest increases were led by sales in motor vehicles and parts dealers, this was the fourth consecutive month of gains. We saw, thanks to rebounding light truck sales.
This has been driven by higher sales at new car dealers and we have seen improved vehicle availability that has made a real impact on the market which has helped to ease pent-up demand. Gas vendors saw increases. We saw software sales and furniture and home furnishing stores which were among the biggest drag for retail sales during the quarter.
Sorry, during the month.
Some of the key implications. The report does fall in line with TD Economics expectation for a rebound in the fourth quarter which in real terms is now tracking at about a 2.3% pays annualized.
Now, current TD spend data estimates point that retail sales annualized growth in the fourth quarter of last year.
As this latest chart shows. It still translates to less than 3% year-over-year growth in the last quarter, making it the smallest yearly gain in holiday sales since the pandemic.
Now while the largest driver of gains were sales, spending on housing purchases did not follow suit despite the update we have seen in home sales over the past three months. Of course Canadians are postponing their purchases particularly in the durable goods sector which often is financed with loans. TD Economics believes that this cautious approach will continue to stamp out goods consumption growth this year.
>> Interesting set. Obviously when you talk about retail sales and the strength of the consumer, we start to think about the Bank of Canada and interest rate policy. One bite we get the rate cut?
>> It depends on the trajectory of inflation. Without a clear signal from the BOC that it is willing to disregard shelter inflation, a more restrictive approach is likely according to TD Economics. This sets up a potential rate cut in the second quarter of 2024.
>> Interesting stuff. Thanks.
>> My pleasure.
>> MoneyTalk's Anthony Okolie.
Now, for an update on the markets.
We are having a look at TD's Advanced Dashboard, platform designed for active traders available through TD Direct Investing.
This is the heat map function, gives you a view of the market movers.
Let's start with the TSX 60, we are screening for price and volume. One conspicuous by their size would be FM, First Quantum, up more than 8%. We talked earlier the problems with the Cobre Panama mine but the headlines out right now is that First Quantum has agreed to sell $1 billion in stock and refinance some debt.
This new bit of financing to shore up the balance sheet seems to be favourable to the street, the stock of more than a percent. The rest of the board right now pales in comparison. Barrick's down to the tune of about 2%.
Got some of the other names, a mixed bag across the screen.
South of the border, the S&P 500 at new highs.
This is an videos moment to shine. We are keeping our eyes on and after the close yesterday. It delivered on the quarter behind it and it delivered a forecast that is pleasing the streets.
Not only is Nvidia up 15%, some of the other chipmakers are feeling the pull of that now, AMD up more than 11%.
Some of the other tech names along for the ride to. Meda standing out, little more than 4% the upside.
You get more information on Advanced Dashboard by visiting TD.com/Advanced Dashboard.
We are back with Daniel Ghali from TD Securities, talking commodities.
Can we get an update on what's happening with platinum?
>> Yeah, platinum is primarily used for auto catalysts.
Everything that we discussed with respect to the slowdown in auto sales, with respect to the rise of EV penetration are relevant for platinum demand. What's interesting is over the last year, platinum prices have actually gone down substantially at a time where you had very significant supply disruptions out of South Africa which mines most of the platinum that the world has access to.
At the same time, despite very strong EV demand growth, total demand growth actually beat records. It was significantly stronger-than-expected.
Secondary supply, like recycled platinum, came in significantly less then most of the analysts had expected.
Yet, prices came down substantially. What is happening there is that speculative flows are significantly larger than physical flows. It's a mirror image of what we initially spoke about with respect to gold and silver. And platinum markets, for this year, we continue to expect the consensus to be wrong on recycled supply.
We still think that's going to come in substantially less than expectations and in turn should tighten physical markets.
This time around, dad happening when speculators are already pretty bearish on it, so it could be a positive tailwind for platinum over the course of the year.
>> Interesting moves there. We are out of time for questions. Before I let you go, I want around back to the top of the conversation, whether you are interested in commodities, equities or tech, we entered this year with the assumption that the Fed is going to be able to start cutting interest rates because they are getting inflation under control.
When that moment comes, you been noticing interesting things about how investors are positioned and perhaps not positioned the way they usually are ahead of a Fed rate cut.
>> We spoke about it was specifically respect to gold and macro traders which is the contingency you would expect to buy gold in anticipation of a Fed cutting cycle are actually now nets short. Their total position today is more consistent with moments of time where they would expect the Fed to hike than moments of time when you expect them to cut. We think that is going to provide substantial tailwinds for gold over the course of this year.
>> Always great to have you. Always a fascinating conversation.
>> Thank you very much.
>> Our thanks to Daniel Ghali, senior commodity strategist with TD Securities.
As always, make sure you do your own research before making any investment decisions.
stay tuned. We will be back tomorrow with an update on the markets and highlights from our interviews of the week.
On Monday, Caitlin Cormier is going to join us, client education instructor with TD Direct Investing.
She wants to take your questions about the WebBroker platform and Advanced Dashboard.
I know you got questions about both. You can get them in ahead of time.
Just email moneytalklive@td.com. That's all the time we have the show today.
Thanks for watching. We will see you tomorrow.
[music]
Every day, I'll be joined by guests from across TD, many of whom you'll only see here.
We're going to take you through what's moving the markets and answer your questions about investing.
Coming up on today's show, TD Securities Daniel Ghali will join us. We will talk about a trend he's been noticing in the gold space that investors may be missing out on.
MoneyTalk's Anthony Okolie will take us to the latest Canadian retail sales report.
In today's education segment, Jason Hnatyk will show us how to use bubble charts on the Advanced Dashboard platform.
So here's how you can get in touch with us.
Just email moneytalklive@td.com or fill out the viewer response box under the video player on WebBroker.
Before we get to all that and our guest of the day, let's get you an update on the markets.
We will start here at home with the TSX Composite Index.
We are in positive territory, 123 points to the upside, a little more than half a percent.
Among some of the most actively traded name standing out for us today is Enerplus, selling itself to Chord Energy.
On that news, the stock is up 10%.
I want to take a look at B2Gold, with their latest earnings report. Gold sitting a bit flat today to the downside modestly.
B2Gold is down almost 2% at $3.33 per share.
South of the border, the big news this week was Nvidia. The street is pleased with the report and the forecast.
Nvidia is pulling up market sentiment across the board. The S&P 500 is up 1.6%, 80 points.
The tech heavy NASDAQ hearing even better, it is up just shy of 2 1/2%. Nvidia is one of those stocks where if they do well, the market as well.
Nvidia is at $776 per share, the stock is up more than $102 or 15%.
And that is your market update.
While the US Federal Reserve has preached patients when it comes to rate cuts, our featured guest today says that investors may be historically under position for the moves that gold might make when those cuts arrive. Joining us now to discuss his Daniel Ghali, Senior commodity strategist with TD Securities. Great to have you back.
>> Thanks for having me.
>> This year, we are awaiting weight cuts.
The thought is they will, but we need to be patient. What about gold? What does it mean for gold?
>> The start of the timing of a rate cutting cycle is less relevant for gold and the total number of cuts on the horizon that we can expect.
What's interesting in the gold market is that today, investors are historically under positioned for a said cutting cycle.
And why wouldn't they be? If you think about the last few years, macro traders in particular and gold have been repeatedly wrongfooted. The types of indicators that they look at like real rates or US dollar has led us astray time and again. Despite the fact that these macro traders are under positioned and after the strong series of growth data in particular in the US, they have built up a sizable net short position, gold prices are still near all-time highs.
So what gives? The answer to that is actually from physical markets. If you look at the relationship between gold and real rates over a very long term horizon, we see that relationship is fairly stable.
There are moments in time where large changes in real rates don't have much of an impact on gold.
That is happening today. The last time this happened was in the early 2000's which is an era where physical markets were larger or larger forces than financial markets and gold.
That's really the reason why gold prices haven't sold off even though macro traders are shorting it.
>> So macro traders shorting, under positioned in terms of what could happen from the Fed.
When we get to the point that we see rate cuts from the Fed. I, I think I TD Securities the thinking is you will get cuts by the summer, Robert Both was on earlier this week, what could he do to the price of gold? Will there be a rush into that trade?
>> Historically, you see a very large amount of capital that starts to move into gold and the reasoning behind that is simple.
The cost of carrying gold at this moment is quite elevated. That relates to the cost of funding your long gold position.
The US dollar interest rate is quite high so that keeps people from buying gold.
As that rate comes down, it reduces the opportunity cost for folks to start buying gold.
What we would expect and we do think the Fed is going to cut rates for the first time in May.
>> As early as May?
>> Absolutely, yes.
Our forecasts are actually for a deeper Fed cutting cycle than the market is currently pricing and because we still expect a meaningful slowdown in growth even though we are no longer anticipating a recession in 2024 in the US, we are expecting growth to blow materially. The market thinks that should be accompanied with a more meaningful Fed cut, more meaningful Fed cuts on the horizon.
>> On my screen I have an ounce of gold at $2031. If the thesis starts to play out, the Fed starts cutting rates and they go deeper than perhaps the market is anticipating, do we have substantial upside for gold?
>> We think so.
We think gold prices can trade on an average quarterly basis as 2250 by the second quarter of this year and really that's on the back of the strong physical market activity that we have seen but also this rush of capital from the investor side which has really been the missing piece from gold to sustain new all-time highs for the time being.
>> Is the biggest factor that these is simply that inflation in the states, it seems we are getting our headline inflation and core inflation down in Canada. The last print out of the US, it was a bit sticky. Is that the greatest risk into gold right now, that inflation doesn't behave?
>> From the macro side, absolutely.
Macro traders are actually net short and gold.
They are already taking positions consistent with that view. The other side of that equation, physical markets, is really what's interesting.
The exceptionally strong demand that we have seen so far this year off China isn't just associated with the lunar new year celebrations. That tends to be the seasonal peak in Chinese buying activity but we are seeing that buying continue to persist beyond that horizon. We also know that there have been a substantial amount of purchases of precious metals more broadly and that's the same case in many parts of the world, including the Middle East and Turkey as well.
So these flows are now larger than the downside pressure that we might see from macro traders from stickier inflation than expected.
>> I want to talk about silver now. Fairly or not, it's considered the poor man's gold. But you've noticed interesting things in this area too.
>> Absolutely. So far this year, silver has dramatically underperformed gold. That is consistent with the macro story that we have been discussing.
When we start to look on the horizon, there are a few very large assumptions that are being taken for granted in the market that we think could be challenged.
The first is that, one of the large assumptions and silver markets is that you will always have silver that is available.
This is a metal that's very intensively used in industrial capacity, solar is increasingly the largest structural driver of demand growth for silver, and we expect that to continue on the horizon.
Most market forecasters out there expect a structural deficit on the horizon.
So I think that begs the question, is there a moment in time where the very large amount of silver inventories that have accumulated over the last several decades will wind down by the strong industrial demand? If that happens, how will we incentivize investors to sell their physical silver holdings to satisfy physical market demand?
>> I was thinking to you, how do you incentivize miners to take more silver out of the ground. It's an interesting time and the fact that we've looked to a lot of metals that we need for many transitions, we will talk about that later, but are we minding enough of it? If we end up with a structural deficit of silver, it has industrial purposes and we need more. Are the miners going to put the money in to take it out of the ground?
>> Silver is traditionally mined as a byproduct of other metals.
It is a byproduct of zinc mines, gold mines, and so forth.
So there is a very well discussed CEM of structural underinvestment in mining activity. That has been the case for the past 12 years at least and that is now having an impact on silver. The difference in silver markets, this has appreciated, this theme has appreciated in other base metal markets, but the difference in silver markets is that there is that assumption that there will always be silver available given that… >> Don't worry about it, it's always coming out of the ground as we pull other things out of the ground.
>> Nobody is throwing away their silver.
Every ounce of silver that has been mined for a very long time still exists somewhere in some form.
The question is, how much of it is actually freely available for purchase?
When we punch in the numbers, we find a significant portion of it is not available for purchase or not occur in prices.
>> Fascinating stuff and a great start to the program. We will get to your questions about commodities for Daniel Ghali in just a moment.
And a reminder that you can get in touch with us any time.
Just email moneytalklive@td.com or fill out the viewer response box under the video player on WebBroker.
Right now, let's get you updated on the top stories in the world of business and take a look at how the markets are trading.
You knew I was going to start with Nvidia.
The stock in the spotlight today.
Right now at $776 per share, let's rounded up, 777, it's up 15%, what's going on?
Their results came out after the markets close yesterday. Not only did the chipmaker deliver on its quarterly earnings report, but it is also forecasting $24 billion in sales for the current quarter, stronger than Wall Street's expectations. Nvidia's gains today are also helping push the S&P 500 to new all-time highs. Closer to home, Loblaw is reporting growth on the top and bottom lines for the most recent quarter. The grocers saw increase the traffic in its stores, notably at its discount banners No Frills, Maxi and Real Canadian Superstore.
At 140 bucks per share, you're up 1.8%.
There is some dealmaking in the energy patch. Calgary-based Enerplus is selling itself to Houston-based Chord Energy Corp in a cash and stock deal valued at some $3.7 billion. The deal is subject to regulatory approval. It had been rumoured for a while. You can see Chord Energy down and Enerplus in positive territory, at $18.19 per share, it's almost 11%.
A quick check on the market, we will start here at home with TSX Composite Index. In positive territory, a gain of 134 points, good for two thirds of a percent.
South of the border, as Nvidia clears the hurdles market had for them and get everyone excited about AI in technology plays, you are seeing a broad-based sentiment lift in the market. The S&P 500 is up 83 points, 1.67%, 5064, touching new all-time highs.
All right, we are back with Daniel Ghali taking your questions about commodities.
Let's get to them. What has happened to the price of oil? A nice blunt, straightforward question.
>> Great question. The price of oil has been under pressure for some time.
More recently, prices have recovered.
Under the hood, there is actually a lot of evidence that supply risk premia has supported oil prices. This is something that we've been discussing for some time as well, that oil prices were not reflecting the rise in geopolitical risks that have occurred since the beginning of the year.
Certainly, the Middle East is a big concern but you also have concerns surrounding military escalation between Venezuela and their joint border with Guyana which was a tremendous success story in terms of oil production.
I think more recently, the internals of crude prices have shown that physical markets are actually quite strong even though prices are fairly range bound, as we discussed.
But there are some signs that the disruptions caused in the Red Sea by the conflict with the Houthis is starting to have less of an impact on crude prices.
So there is some signs that the strength that we have seen, aided by supply risk premia, is starting to ease.
>> Is it a case of obviously we know these geopolitical conflicts do put a lot of risk into play but until it actually means that supply is constrained, the market is not going to react all that dramatically?
>> Often times, that's the case.
In this case, supply has been impacted.
In some ways, the conflict in the Red Sea has diverted ships, so that causes a temporary dislocation in physical markets.
That's probably with helping supply risk premia ease today, that ships are starting to arrive in Europe in particular and in turn we should see steady flow shifts which will have fewer implications for prices.
But you also have had taxes on Russian refineries as well. These are relevant for global product and market.
>> Is China a big concern? We think about in North America we live through a year and 1/2 now of talk of a recession coming.
People put that recession narrative over there. But there are concerns about the world's second-largest economy in terms of what they are willing to do to stoke the growth and whether they are doing enough.
>> There has been an extreme amount of pessimism surrounding China's economy.
We actually don't see that cooperated the data out of China.
It does seem to us that demand sentiment out of China has been oversold and there are some preliminary signs that that is currently repricing, aided by the strong performance of Chinese equity indices and I think government officials have supported that market to aid overall sentiment in China.
>> Okay, I just did what we call in the industry mowing the lawn of one of our viewers next question. They want to ask you about the slowdown in China and how that could impact commodities.
We talked about oil but obviously China is a big buyer for a lot of commodities.
>> Absolutely.
You mentioned that soft landing has become more of a consensus narrative in the West.
Our tracking growth expectations are actually pointing to the fact that the soft landing story in the US is not exceptional to the US. There is a trend across China, across Europe and the US of rising growth expectations.
So this is certainly a concern for commodities markets and China could still disappoint but it does seem to us like the worst is now in the rear review.
>> If China's appetite returns, if China gets hungry again for commodities, could this set off a supercycle?
>> Absolutely.
Well, the supercycle story really depends on which market we are talking about.
There are a few ways that it can play out.
The one you mentioned is the demand side of the equation. So far, we have had very strong green demand offset by weakness in the traditional manufacturing sectors and real estate sectors, especially out of China.
But if both of those components of demand start to move in the same direction, certainly that will bring the supercycle forward for metals like copper in particular were even silver as we mentioned.
I would also say that other ways the supercycle could play out is from the supply side. Aluminum is one great example of a market where governments are proactively constraining its supply growth given that it's a carbon intensive industry.
So not only do you have a boom from the demand side but you also have governments proactively curtailing the supply side which should benefit a little bit more and bring forth that supercycle.
>> China is an economy to keep an eye on for many reasons. Another audience question. What could Fed rate cuts mean for commodities generally?
>> Generally speaking, Fed rate cuts tend to improve the growth outlook. Part of the easing and financial conditions that we have seen so far is related to expectations for Fed rate cuts, even though the Fed has not cut yet, the market has started to price those rate cuts in and market participation and market rate so that is relevant for the growth outlook even today.
So that's the channel that is most important for commodities and markets and I'd say the other China would be the opportunity cost.
We spoke about in the context of gold.
Currently, cash fields are quite high and that means that it's actually quite expensive to own a gold position. So as interest rates come down, not only do you have a growth boost which should benefit assets like copper and oil but you also have a decline in the opportunity cost which should benefit gold in particular.
>> On the currency side, we have currency Saying If You Enter a Fed Rate Cutting Cycle, You Expect the US Dollar Which Has Shown Strength to Start Pulling Back As Well. We Have To Worry about Currency to?
Often You Hear a Simple Explanation. The US Bucket Hires Oil Is Lower Because Oil Is Denominated in US Bucks.
>> Is incredibly complicated.
I think from our affect strategy team, the point that they bring home is precisely that the soft landing is not exceptional to the US. Even though the US dollar has been rallying because people of them pushing back the expectations for the Fed cut cycle, the growth story improving in China and Europe is actually negative for the US dollar and that's probably more important.
>> Fascinating stuff.
As always, make sure you do your own research before making any investment decisions.
we will get back to questions for Daniel Ghali on commodities in just a moment's time.
And a reminder that you can get in touch with us any time. Just email moneytalklive@td.com.
Now, let's get our educational segment of the day.
In today's segment, we are going to have a look at one of the different chart tools available on Advanced Dashboard.
Joining us now for more Jason Hnatyk, Senior client education instructor with TD Direct Investing. Great to see you. You're going to talk to us about bubble charts.
Take away.
>> Advanced Dashboard has lots of very unique tools that can only be found in the platform itself to really help you visualize how the market itself has been performing. I'm going to show you the bubble charts here today which will allow us to compare and contrast how different industries or sectors are performing you and let's jump into WebBroker and take a look at this right now.
Not WebBroker, Advanced Dashboard in this case. You are noticing a lot of bubbles in the centre of the screen.
The tool is very aptly named.
These are bubbles representing the TSX 60.
That is the default chart. Taking a look in the top left-hand corner, there is a drop-down menu that you can take a look at the other major indices as well as Canadian and US sectors.
Whatever you are looking for, we have that opportunity for you to do a deeper dive.
As it is set up now, this is judging the TSX 60 companies in terms of their relative performance over the last year.
The higher the bubble is, the higher performance has been over that time. A nasty progress to the right side of the chart, we can see that the companies begin to go lower based on the performance.
The next thing to point out is going to be the colours of these bubbles.
It's been on purpose that they been colour-coded.
That's so we can help to spot high-performing sectors. They are based on an individual area of the economy or market that you happen to be looking at.
We have a couple of different companies near the top of the list. That's our technology sector. The key is at the bottom of the chart.
You're looking to maybe make this… You don't want to miss the forest for the trees. We can add and remove sectors just by clicking. Let's say we want to remove the technology sector and the energy sector because we are looking to maybe do some analysis or diversify into other areas.
We now have a more clear picture where we can compare and contrast the sectors against each other just by clicking on the bottom and we can add them back in simply by tapping on the name.
Moving next to how we can adjust how we are analysing the companies against each other, you will notice that just to the right of where we were cycling through the different indices and sectors, we got the opportunity to select different areas where we can compare and contrast.
We can compare with market cap, get into more fundamental natures such as PE or yields or return on investment, things like that, great opportunities to narrow it down.
Then we get to choose other time frames and variables to compare them against.
Lastly, we talked about the colour of the bubbles. The last thing is to highlight the fact that the size of the bubble is defaulted based on market cap.
The bigger the company is, the bigger the valuation and the bigger the bubble represented on the chart.
That's all going to be just the agreed-upon metric, that something you have the ability to make that your own and really make sure you're getting the information you want to get out of the bubble chart.
Very cool tool to help you with analysis.
>> We got the bubble charts. We understand what we want to look at them. One thing that I find useful in Advanced Dashboard is being able to link this piece of information to other pieces of information. How do you start linking these bubble charts the other parts of the platform?
>> You're going to get the information that you want, where you want to see and what you want to see. Jumping back into Advanced Dashboard, I'm going to highlight the Market Pulse tab located at the top of the page. This is the factory default setting that everyone is going to have.
The bubble chart is loaded into this area.
What I want to highlight for everybody is that there are these vertical rectangles of the top of the page. This is how we link the tools together.
This happens to be linked to the green channel. All of the other components on this page are linked to the green channel.
If I go ahead and select one company, out of the list, I click on Shopify.
You are noticing that a quote is popping up.
Our option chain is popping up as well.
There are different tabs. News is available for me to get specific to the company and that's not just limited to only within the same tab. If we look at different tabs that everyone will have available, I'm going to go to the analytics tab, it's linked to here as well so it's linked to the green component. We got financial statements, we can look at, let's see, we've got other ratios and things like that so once again is just scratching the surface in terms of what's available but one click on a little bubble is able to give me a wide perspective of what's going on across the economy and if we are drilling down into that individual security as well.
>> Thanks for that.
>> It's my pleasure.
>> Jason Hnatyk, Senior client education instructor at TD Direct Investing.
And make sure to check out the learning centre in WebBroker for more educational videos, live, interactive master classes and upcoming webinars.
Now before we get back to your questions about commodities for Daniel Ghali, a reminder of how you can get in touch with us.
Do you have a question about investing or what's driving the markets?
Our guests are eager to hear what's on your mind, so send us your questions.
There are two ways you can get in touch with us.
You can send us an email anytime at moneytalklive@td.com or you can use the question box right below the screen here on WebBroker. Just write in your question and hit send.
We'll see if one of our guests can get you the answer right here at MoneyTalk Live.
Okay, we're back with Daniel Ghali, taking your questions about commodities.
This one is on copper. What do you expect the supply and demand of copper to look like in the next two years?
>> That's a really interesting one because if we were to have the discussion in November of last year, the answer would probably be significantly different. We have had a series of very significant disappointments on the supply side. These relate to legacy projects that start perhaps around the year 2017 which were just about to come to completion that were expected to shift the market balance to a pretty significant surplus, especially over the next 12 months and less so beyond there.
So that was the period of time that would have seen a surplus before a period of structural deficits. Increasingly, it looks like copper markets are going to be in a deficit this year even though we expected a surplus not too long ago.
>> The Cobre Panama situation where you thought you're gonna have this massive, the world's biggest were one of the world's biggest copper mines coming online and then obviously there are things going on in Panama right now but that mind is not operating.
>> That's a big chunk of it.
Ultimately what this means is that the period of structural deficits and copper might be coming as soon as this year.
So we do have critically low inventories and copper markets and a period of time work demand is going to grow at a very fast pace.
So that is troublesome for copper markets and it does suggest that copper prices are actually still substantially below where they need to be in order to incentivize new production on the horizon.
>> We talk about copper and electrification and when we talk about the world trying to green itself through the electrification of everything, including cars, you're gonna need a lot of copper.
Do the headlines around the EVs and demand being soft way on copper in a way that perhaps it shouldn't?
>> I think so. In some ways, there has been a pessimistic tone surrounding the EV boom.
Globally, EV sales are accepted to grow at around 20% year on year.
That is a slower pace than the prior year but it's still tremendous growth and even though the concerns probably relate more to battery electric vehicles and increasingly hybrids are one way that automakers are pushing for, they still consume substantially more copper than traditional combustion engine. This is still in our view a very positive outlook for copper demand growth.
>> This is a question about geopolitics.
Are we still seeing an impact on commodities from the Ukraine Russia conflict?
>> What's fascinating about commodities markets is that they have reshuffled themselves in the aftermath of the conflict with Russia at a really fast pace, far faster than most commodity strategies expected by the world and by us. So far, there have been fairly few disruptions as a result of that. Flows were reshuffled but not wiped out. Part of the reason is that sanctions enforcement was really lax, far more lax than governments had initially thought of.
So far, there aren't that many disruptions for energy markets in particular, nor are there for the types of commodities that Russia produces a lot of, things like aluminum or palladium but we have seen those flows reshuffled across the world.
>> What about the prospect of more sanctions? Obviously tensions have not eased at all between the United States and Russia. Could we be seeing more sanctions or perhaps more strenuously and for sanctions?
>> That is a source of concern.
This week, we heard that the US is going to announce sanctions, new sanctions on Russia which initially sent aluminum prices, palladium prices, copper prices quite significantly higher. So far, prices have come off in a synchronized fashion as well which tells you that there is some scepticism around whether Western nations will sanction access to these commodities because there is a sense that that is self punitive. But that is something we should hear more about this Friday.
>> Okay. Let's get another question now from the audience.
How is the slump in EV sales heading commodities?
We talked very specifically about copper and electrification, but we know that when it comes to EVs there is more than just that.
>> We spoke about the fact that EV sales are slumping. This is probably the battery electric segment but overall globally, electric vehicle sales are rising at a really fast pace. So this is very useful for copper as we discussed but it's also useful for a variety of different commodities. Metals are, the peace that I would look at, aluminum is more heavily used in electric vehicles, same strategy for zinc. The other side of the equation is actually there is some evidence that the much faster penetration of electric vehicles then was initially anticipated is starting to impact oil demand as well.
That's a negative for oil demand. I think today, globally, EVs are about 4% of the fleet and it's actually starting to show up in demand forecasts for oil.
This is the first time that it's a material reduction related to electric vehicles.
>> Fascinating things to consider when talking about the EV market and demand. We will get back to your questions for Daniel Ghali in just a moment's time.
As always, make sure you do your own research before making any investment decisions.
And a reminder that you can get in touch with us at any time. Do you have a question about investing or what's driving the markets?
Our guests are eager to hear what's on your mind, so send us your questions.
There are two ways you can get in touch with us.
You can send us an email anytime at moneytalklive@td.com or you can use the question box right below the screen here on WebBroker. Just write in your question and hit send.
We'll see if one of our guests can get you the answer right here at MoneyTalk Live.
We saw a rebound in December in retail sales in this country, a big boost from auto sales, but 2023 still marked the slowest year for holiday sales since the pandemic began.
Anthony Okolie joins us now with TD Economics take on the latest numbers and what we might be seeing the rest of the year.
>> Canadian retail sales did rebound, they are a .9% month over month in December, slightly higher versus stats Canada's flash estimate of .8%.
Today's growth even stronger adjusted for inflation. Retail sales were up .8%. Stats Canada's advance read for January points to a bit of a pullback. It suggests that sales slowed down to 0.4% based on respondents from roughly half of retailers surveyed. So you're down 0.4%.
Gains were seen in five out of the nine subsectors. The biggest increases were led by sales in motor vehicles and parts dealers, this was the fourth consecutive month of gains. We saw, thanks to rebounding light truck sales.
This has been driven by higher sales at new car dealers and we have seen improved vehicle availability that has made a real impact on the market which has helped to ease pent-up demand. Gas vendors saw increases. We saw software sales and furniture and home furnishing stores which were among the biggest drag for retail sales during the quarter.
Sorry, during the month.
Some of the key implications. The report does fall in line with TD Economics expectation for a rebound in the fourth quarter which in real terms is now tracking at about a 2.3% pays annualized.
Now, current TD spend data estimates point that retail sales annualized growth in the fourth quarter of last year.
As this latest chart shows. It still translates to less than 3% year-over-year growth in the last quarter, making it the smallest yearly gain in holiday sales since the pandemic.
Now while the largest driver of gains were sales, spending on housing purchases did not follow suit despite the update we have seen in home sales over the past three months. Of course Canadians are postponing their purchases particularly in the durable goods sector which often is financed with loans. TD Economics believes that this cautious approach will continue to stamp out goods consumption growth this year.
>> Interesting set. Obviously when you talk about retail sales and the strength of the consumer, we start to think about the Bank of Canada and interest rate policy. One bite we get the rate cut?
>> It depends on the trajectory of inflation. Without a clear signal from the BOC that it is willing to disregard shelter inflation, a more restrictive approach is likely according to TD Economics. This sets up a potential rate cut in the second quarter of 2024.
>> Interesting stuff. Thanks.
>> My pleasure.
>> MoneyTalk's Anthony Okolie.
Now, for an update on the markets.
We are having a look at TD's Advanced Dashboard, platform designed for active traders available through TD Direct Investing.
This is the heat map function, gives you a view of the market movers.
Let's start with the TSX 60, we are screening for price and volume. One conspicuous by their size would be FM, First Quantum, up more than 8%. We talked earlier the problems with the Cobre Panama mine but the headlines out right now is that First Quantum has agreed to sell $1 billion in stock and refinance some debt.
This new bit of financing to shore up the balance sheet seems to be favourable to the street, the stock of more than a percent. The rest of the board right now pales in comparison. Barrick's down to the tune of about 2%.
Got some of the other names, a mixed bag across the screen.
South of the border, the S&P 500 at new highs.
This is an videos moment to shine. We are keeping our eyes on and after the close yesterday. It delivered on the quarter behind it and it delivered a forecast that is pleasing the streets.
Not only is Nvidia up 15%, some of the other chipmakers are feeling the pull of that now, AMD up more than 11%.
Some of the other tech names along for the ride to. Meda standing out, little more than 4% the upside.
You get more information on Advanced Dashboard by visiting TD.com/Advanced Dashboard.
We are back with Daniel Ghali from TD Securities, talking commodities.
Can we get an update on what's happening with platinum?
>> Yeah, platinum is primarily used for auto catalysts.
Everything that we discussed with respect to the slowdown in auto sales, with respect to the rise of EV penetration are relevant for platinum demand. What's interesting is over the last year, platinum prices have actually gone down substantially at a time where you had very significant supply disruptions out of South Africa which mines most of the platinum that the world has access to.
At the same time, despite very strong EV demand growth, total demand growth actually beat records. It was significantly stronger-than-expected.
Secondary supply, like recycled platinum, came in significantly less then most of the analysts had expected.
Yet, prices came down substantially. What is happening there is that speculative flows are significantly larger than physical flows. It's a mirror image of what we initially spoke about with respect to gold and silver. And platinum markets, for this year, we continue to expect the consensus to be wrong on recycled supply.
We still think that's going to come in substantially less than expectations and in turn should tighten physical markets.
This time around, dad happening when speculators are already pretty bearish on it, so it could be a positive tailwind for platinum over the course of the year.
>> Interesting moves there. We are out of time for questions. Before I let you go, I want around back to the top of the conversation, whether you are interested in commodities, equities or tech, we entered this year with the assumption that the Fed is going to be able to start cutting interest rates because they are getting inflation under control.
When that moment comes, you been noticing interesting things about how investors are positioned and perhaps not positioned the way they usually are ahead of a Fed rate cut.
>> We spoke about it was specifically respect to gold and macro traders which is the contingency you would expect to buy gold in anticipation of a Fed cutting cycle are actually now nets short. Their total position today is more consistent with moments of time where they would expect the Fed to hike than moments of time when you expect them to cut. We think that is going to provide substantial tailwinds for gold over the course of this year.
>> Always great to have you. Always a fascinating conversation.
>> Thank you very much.
>> Our thanks to Daniel Ghali, senior commodity strategist with TD Securities.
As always, make sure you do your own research before making any investment decisions.
stay tuned. We will be back tomorrow with an update on the markets and highlights from our interviews of the week.
On Monday, Caitlin Cormier is going to join us, client education instructor with TD Direct Investing.
She wants to take your questions about the WebBroker platform and Advanced Dashboard.
I know you got questions about both. You can get them in ahead of time.
Just email moneytalklive@td.com. That's all the time we have the show today.
Thanks for watching. We will see you tomorrow.
[music]